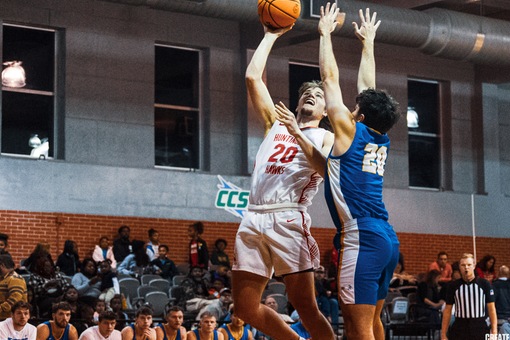
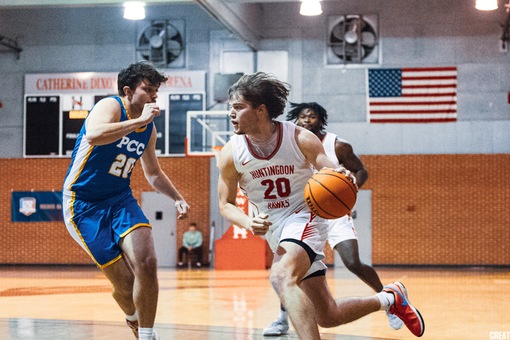
20 Tate Goolesby

-
- Height:
- 6'6
-
- Year:
- Jr.
-
- Hometown:
- Henager, Ala.
-
- High School:
- Fyffe High School
-
- Position:
- G
-
- gp
- 26
-
- pts/g
- 6.5
-
- fg %
- 39.4
-
- 3pt %
- 19.0
-
- ft %
- 55.8
-
- reb/g
- 4.8
-
- a/g
- 1.1
Player Profile
| Overall | Conf | |||
|---|---|---|---|---|
| Games | 26 | 12 | ||
| Games started | 25 | 11 | ||
| Minutes | 628 | 290 | ||
| Minutes per game | 24.2 | 24.2 | ||
| FG | 65-165 | 31-76 | ||
| FG Pct | 39.4 | 40.8 | ||
| 3PT | 11-58 | 7-24 | ||
| 3PT Pct | 19.0 | 29.2 | ||
| FT | 29-52 | 17-30 | ||
| FT Pct | 55.8 | 56.7 | ||
| Off rebounds | 45 | 21 | ||
| Def rebounds | 81 | 35 | ||
| Total rebounds | 126 | 56 | ||
| Rebounds per game | 4.8 | 4.7 | ||
| Personal fouls | 66 | 33 | ||
| Disqualifications | 1 | 0 | ||
| Assists | 28 | 10 | ||
| Turnovers | 48 | 22 | ||
| Assist to turnover ratio | 0.6 | 0.5 | ||
| Steals | 8 | 4 | ||
| Blocks | 8 | 5 | ||
| Points | 170 | 86 | ||
| Points per game | 6.5 | 7.2 | ||
| Points per 40 min | 10.8 | 11.9 | ||
Game Log - Shooting
| Date | Opponent | Score | gs | min | fg | pct | 3pt | pct | ft | pct | pts |
|---|---|---|---|---|---|---|---|---|---|---|---|
| Nov 8 | Lyon | W, 87-77 | 1 | 29 | 3-8 | 37.5 | 0-3 | 0.0 | 0-0 | - | 6 |
| Nov 11 | Centenary (La.) | L, 89-70 | 1 | 22 | 2-6 | 33.3 | 1-3 | 33.3 | 1-3 | 33.3 | 6 |
| Nov 12 | Millsaps | W, 87-71 | 1 | 19 | 2-5 | 40.0 | 0-2 | 0.0 | 0-0 | - | 4 |
| Nov 18 | vs. Oglethorpe | L, 87-85 | 1 | 32 | 2-7 | 28.6 | 0-4 | 0.0 | 2-4 | 50.0 | 6 |
| Nov 19 | vs. Centre | L, 87-81 | 1 | 20 | 0-2 | 0.0 | 0-1 | 0.0 | 2-2 | 100.0 | 2 |
| Nov 21 | at MUW | L, 83-80 | 1 | 22 | 3-6 | 50.0 | 1-2 | 50.0 | 0-1 | 0.0 | 7 |
| Nov 28 | Pensacola Christian | W, 78-67 | 1 | 29 | 7-13 | 53.8 | 1-5 | 20.0 | 1-2 | 50.0 | 16 |
| Nov 29 | at Millsaps | W, 87-56 | 1 | 18 | 2-8 | 25.0 | 0-6 | 0.0 | 0-0 | - | 4 |
| Dec 3 | at Rhodes | L, 109-89 | 1 | 23 | 2-4 | 50.0 | 0-0 | - | 1-4 | 25.0 | 5 |
| Dec 4 | at Welch College | W, 74-67 | 1 | 18 | 4-9 | 44.4 | 1-1 | 100.0 | 2-2 | 100.0 | 11 |
| Dec 8 | at Pensacola Christian | W, 77-73 | 1 | 24 | 3-6 | 50.0 | 0-1 | 0.0 | 0-0 | - | 6 |
| Dec 15 | at Bob Jones | L, 101-91 | 1 | 19 | 2-6 | 33.3 | 0-2 | 0.0 | 1-2 | 50.0 | 5 |
| Dec 15 | at Bob Jones | L, 101-91 | 1 | 19 | 2-6 | 33.3 | 0-2 | 0.0 | 1-2 | 50.0 | 5 |
| Dec 19 | at Montevallo | L, 99-94 | 1 | 29 | 2-5 | 40.0 | 0-2 | 0.0 | 4-5 | 80.0 | 8 |
| Dec 30 | at Paine | L, 82-68 | 1 | 30 | 2-6 | 33.3 | 0-1 | 0.0 | 2-2 | 100.0 | 6 |
| Jan 5 | at Covenant | W, 77-74 | 1 | 30 | 4-10 | 40.0 | 0-2 | 0.0 | 0-2 | 0.0 | 8 |
| Jan 6 | at Piedmont | W, 95-81 | 1 | 31 | 3-7 | 42.9 | 0-1 | 0.0 | 2-2 | 100.0 | 8 |
| Jan 12 | Maryville (Tenn.) | L, 109-68 | 1 | 22 | 2-3 | 66.7 | 0-0 | - | 2-2 | 100.0 | 6 |
| Jan 13 | Berea | L, 75-71 | 1 | 21 | 2-6 | 33.3 | 2-2 | 100.0 | 1-2 | 50.0 | 7 |
| Jan 20 | at LaGrange | L, 100-96 | 1 | 27 | 5-12 | 41.7 | 1-4 | 25.0 | 2-4 | 50.0 | 13 |
| Jan 30 | Belhaven | L, 85-78 | 1 | 26 | 1-5 | 20.0 | 0-1 | 0.0 | 2-3 | 66.7 | 4 |
| Feb 2 | at Berea | W, 86-79 | 1 | 16 | 1-2 | 50.0 | 0-1 | 0.0 | 0-0 | - | 2 |
| Feb 3 | at Maryville (Tenn.) | L, 101-90 | 1 | 27 | 7-10 | 70.0 | 2-3 | 66.7 | 2-3 | 66.7 | 18 |
| Feb 9 | Piedmont | L, 83-75 | 1 | 32 | 1-5 | 20.0 | 0-1 | 0.0 | 1-2 | 50.0 | 3 |
| Feb 10 | Covenant | W, 77-65 | - | 24 | 2-7 | 28.6 | 0-3 | 0.0 | 3-6 | 50.0 | 7 |
| Feb 14 | at Belhaven | W, 97-80 | 1 | 15 | 1-2 | 50.0 | 1-2 | 50.0 | 2-4 | 50.0 | 5 |
| Feb 17 | LaGrange | W, 100-81 | 1 | 19 | 2-7 | 28.6 | 1-4 | 25.0 | 0-0 | - | 5 |
| Feb 20 | at LaGrange | L, 85-72 | 1 | 33 | 0-3 | 0.0 | 0-3 | 0.0 | 0-0 | - | 0 |
Game Log - Ball control
| Date | Opponent | Score | gs | min | off | def | reb | ast | to | a/to | stl | blk | pf | dq |
|---|---|---|---|---|---|---|---|---|---|---|---|---|---|---|
| Nov 8 | Lyon | W, 87-77 | 1 | 29 | 3 | 5 | 8 | 2 | 2 | 1.0 | 1 | 0 | 2 | - |
| Nov 11 | Centenary (La.) | L, 89-70 | 1 | 22 | 1 | 5 | 6 | 1 | 2 | 0.5 | 0 | 0 | 3 | - |
| Nov 12 | Millsaps | W, 87-71 | 1 | 19 | 0 | 1 | 1 | 2 | 0 | - | 1 | 1 | 2 | - |
| Nov 18 | vs. Oglethorpe | L, 87-85 | 1 | 32 | 0 | 3 | 3 | 1 | 2 | 0.5 | 0 | 0 | 2 | - |
| Nov 19 | vs. Centre | L, 87-81 | 1 | 20 | 1 | 4 | 5 | 4 | 2 | 2.0 | 0 | 0 | 3 | - |
| Nov 21 | at MUW | L, 83-80 | 1 | 22 | 1 | 0 | 1 | 0 | 3 | 0.0 | 0 | 0 | 4 | 0 |
| Nov 28 | Pensacola Christian | W, 78-67 | 1 | 29 | 4 | 3 | 7 | 0 | 1 | 0.0 | 0 | 0 | 1 | - |
| Nov 29 | at Millsaps | W, 87-56 | 1 | 18 | 2 | 1 | 3 | 1 | 2 | 0.5 | 0 | 0 | 1 | 0 |
| Dec 3 | at Rhodes | L, 109-89 | 1 | 23 | 1 | 4 | 5 | 0 | 1 | 0.0 | 1 | 0 | 1 | 0 |
| Dec 4 | at Welch College | W, 74-67 | 1 | 18 | 8 | 3 | 11 | 3 | 4 | 0.8 | 0 | 0 | 2 | - |
| Dec 8 | at Pensacola Christian | W, 77-73 | 1 | 24 | 1 | 6 | 7 | 0 | 0 | - | 0 | 2 | 1 | 0 |
| Dec 15 | at Bob Jones | L, 101-91 | 1 | 19 | 2 | 3 | 5 | 2 | 3 | 0.7 | 0 | 0 | 1 | - |
| Dec 15 | at Bob Jones | L, 101-91 | 1 | 19 | 2 | 3 | 5 | 2 | 3 | 0.7 | 0 | 0 | 1 | - |
| Dec 19 | at Montevallo | L, 99-94 | 1 | 29 | 4 | 5 | 9 | 0 | 2 | 0.0 | 1 | 3 | 5 | 1 |
| Dec 30 | at Paine | L, 82-68 | 1 | 30 | 0 | 4 | 4 | 2 | 3 | 0.7 | 1 | 0 | 4 | 0 |
| Jan 5 | at Covenant | W, 77-74 | 1 | 30 | 3 | 8 | 11 | 0 | 1 | 0.0 | 0 | 0 | 4 | 0 |
| Jan 6 | at Piedmont | W, 95-81 | 1 | 31 | 3 | 5 | 8 | 1 | 1 | 1.0 | 1 | 1 | 2 | 0 |
| Jan 12 | Maryville (Tenn.) | L, 109-68 | 1 | 22 | 1 | 2 | 3 | 0 | 2 | 0.0 | 0 | 0 | 2 | - |
| Jan 13 | Berea | L, 75-71 | 1 | 21 | 1 | 2 | 3 | 0 | 5 | 0.0 | 1 | 1 | 4 | - |
| Jan 20 | at LaGrange | L, 100-96 | 1 | 27 | 5 | 3 | 8 | 5 | 4 | 1.3 | 0 | 0 | 3 | 0 |
| Jan 30 | Belhaven | L, 85-78 | 1 | 26 | 1 | 3 | 4 | 0 | 1 | 0.0 | 0 | 2 | 4 | - |
| Feb 2 | at Berea | W, 86-79 | 1 | 16 | 0 | 2 | 2 | 0 | 2 | 0.0 | 0 | 0 | 4 | 0 |
| Feb 3 | at Maryville (Tenn.) | L, 101-90 | 1 | 27 | 3 | 3 | 6 | 0 | 1 | 0.0 | 1 | 0 | 0 | 0 |
| Feb 9 | Piedmont | L, 83-75 | 1 | 32 | 2 | 3 | 5 | 1 | 0 | - | 0 | 1 | 1 | - |
| Feb 10 | Covenant | W, 77-65 | - | 24 | 1 | 2 | 3 | 1 | 1 | 1.0 | 0 | 0 | 2 | - |
| Feb 14 | at Belhaven | W, 97-80 | 1 | 15 | 1 | 1 | 2 | 1 | 0 | - | 0 | 0 | 4 | 0 |
| Feb 17 | LaGrange | W, 100-81 | 1 | 19 | 0 | 1 | 1 | 1 | 4 | 0.3 | 1 | 0 | 3 | - |
| Feb 20 | at LaGrange | L, 85-72 | 1 | 33 | 0 | 4 | 4 | 0 | 1 | 0.0 | 0 | 0 | 6 | 1 |
Career Stats - Shooting per game
Career Stats - Shooting per 40 min
| gp | gs | min/g | fg/40 | pct | 3pt/40 | pct | ft/40 | pct | pts/40 | |
|---|---|---|---|---|---|---|---|---|---|---|
| 2021-22 | 22 | 5 | 11.5 | 1.7-7.3 | 23.9 | 0.5-3.5 | 13.6 | 1.7-2.7 | 64.7 | 5.7 |
| 2022-23 | 21 | 18 | 21.4 | 5.9-13.7 | 42.9 | 1.8-5.5 | 32.3 | 2.2-4.0 | 55.6 | 15.8 |
| 2023-24 | 26 | 25 | 24.2 | 4.1-10.5 | 39.4 | 0.7-3.7 | 19.0 | 1.8-3.3 | 55.8 | 10.8 |
| Total | 69 | 48 | 19.3 | 4.3-11.0 | 38.9 | 1.0-4.3 | 23.9 | 2.0-3.4 | 57.0 | 11.5 |
Career Stats - Ball control per game
Career Stats - Ball control per 40 min
| gp | gs | mpg | off/40 | def/40 | reb/40 | pf/40 | dq/40 | ast/40 | to/40 | a/to | stl/40 | blk/40 | |
|---|---|---|---|---|---|---|---|---|---|---|---|---|---|
| 2021-22 | 22 | 5 | 11.5 | 2.4 | 4.9 | 7.3 | 5.2 | 0.2 | 1.1 | 3.3 | 0.3 | 0.8 | 0.5 |
| 2022-23 | 21 | 18 | 21.4 | 2.5 | 2.8 | 5.3 | 5.7 | 0.3 | 1.3 | 3.1 | 0.4 | 0.3 | 0.5 |
| 2023-24 | 26 | 25 | 24.2 | 2.9 | 5.2 | 8.0 | 4.2 | 0.1 | 1.8 | 3.1 | 0.6 | 0.5 | 0.5 |
| Total | 69 | 48 | 19.3 | 2.6 | 4.3 | 6.9 | 4.9 | 0.2 | 1.5 | 3.1 | 0.5 | 0.5 | 0.5 |
Splits Stats - Shooting per game
| gp | gs | min/g | fg/g | pct | 3pt/g | pct | ft/g | pct | ppg | ||
|---|---|---|---|---|---|---|---|---|---|---|---|
| Event | Total | 26 | 25 | 24.2 | 2.5-6.3 | 39.4 | 0.4-2.2 | 19.0 | 1.1-2.0 | 55.8 | 6.5 |
| Conference | 12 | 11 | 24.2 | 2.6-6.3 | 40.8 | 0.6-2.0 | 29.2 | 1.4-2.5 | 56.7 | 7.2 | |
| Exhibition | 2 | 2 | 24.0 | 2.0-5.5 | 36.4 | 0.0-2.0 | 0.0 | 2.5-3.5 | 71.4 | 6.5 | |
| Location | Home | 10 | 9 | 24.3 | 2.4-6.5 | 36.9 | 0.5-2.4 | 20.8 | 1.1-2.0 | 55.0 | 6.4 |
| Away | 14 | 14 | 23.8 | 2.8-6.5 | 42.9 | 0.4-2.1 | 20.7 | 1.0-1.9 | 53.8 | 7.0 | |
| Neutral | 2 | 2 | 26.0 | 1.0-4.5 | 22.2 | 0.0-2.5 | 0.0 | 2.0-3.0 | 66.7 | 4.0 | |
| Result | Wins | 12 | 11 | 22.7 | 2.8-7.0 | 40.5 | 0.3-2.6 | 12.9 | 0.8-1.5 | 55.6 | 6.8 |
| Losses | 14 | 14 | 25.4 | 2.2-5.8 | 38.3 | 0.5-1.9 | 25.9 | 1.4-2.4 | 55.9 | 6.3 | |
| Month | November | 8 | 8 | 23.9 | 2.6-6.9 | 38.2 | 0.4-3.2 | 11.5 | 0.8-1.5 | 50.0 | 6.4 |
| December | 5 | 5 | 22.8 | 2.6-6.2 | 41.9 | 0.2-1.0 | 20.0 | 1.2-2.0 | 60.0 | 6.6 | |
| January | 6 | 6 | 26.2 | 2.8-7.2 | 39.5 | 0.5-1.7 | 30.0 | 1.5-2.5 | 60.0 | 7.7 | |
| February | 7 | 6 | 23.7 | 2.0-5.1 | 38.9 | 0.6-2.4 | 23.5 | 1.1-2.1 | 53.3 | 5.7 |
Splits Stats - Shooting totals
| gp | gs | min | fg | pct | 3pt | pct | ft | pct | pts | ||
|---|---|---|---|---|---|---|---|---|---|---|---|
| Event | Total | 26 | 25 | 628 | 65-165 | 39.4 | 11-58 | 19.0 | 29-52 | 55.8 | 170 |
| Conference | 12 | 11 | 290 | 31-76 | 40.8 | 7-24 | 29.2 | 17-30 | 56.7 | 86 | |
| Exhibition | 2 | 2 | 48 | 4-11 | 36.4 | 0-4 | 0.0 | 5-7 | 71.4 | 13 | |
| Location | Home | 10 | 9 | 243 | 24-65 | 36.9 | 5-24 | 20.8 | 11-20 | 55.0 | 64 |
| Away | 14 | 14 | 333 | 39-91 | 42.9 | 6-29 | 20.7 | 14-26 | 53.8 | 98 | |
| Neutral | 2 | 2 | 52 | 2-9 | 22.2 | 0-5 | 0.0 | 4-6 | 66.7 | 8 | |
| Result | Wins | 12 | 11 | 272 | 34-84 | 40.5 | 4-31 | 12.9 | 10-18 | 55.6 | 82 |
| Losses | 14 | 14 | 356 | 31-81 | 38.3 | 7-27 | 25.9 | 19-34 | 55.9 | 88 | |
| Month | November | 8 | 8 | 191 | 21-55 | 38.2 | 3-26 | 11.5 | 6-12 | 50.0 | 51 |
| December | 5 | 5 | 114 | 13-31 | 41.9 | 1-5 | 20.0 | 6-10 | 60.0 | 33 | |
| January | 6 | 6 | 157 | 17-43 | 39.5 | 3-10 | 30.0 | 9-15 | 60.0 | 46 | |
| February | 7 | 6 | 166 | 14-36 | 38.9 | 4-17 | 23.5 | 8-15 | 53.3 | 40 |
Splits Stats - Shooting per 40 min
| gp | gs | min/g | fg/40 | pct | 3pt/40 | pct | ft/40 | pct | pts/40 | ||
|---|---|---|---|---|---|---|---|---|---|---|---|
| Event | Total | 26 | 25 | 24.2 | 4.1-10.5 | 39.4 | 0.7-3.7 | 19.0 | 1.8-3.3 | 55.8 | 10.8 |
| Conference | 12 | 11 | 24.2 | 4.3-10.5 | 40.8 | 1.0-3.3 | 29.2 | 2.3-4.1 | 56.7 | 11.9 | |
| Exhibition | 2 | 2 | 24.0 | 3.3-9.2 | 36.4 | 0.0-3.3 | 0.0 | 4.2-5.8 | 71.4 | 10.8 | |
| Location | Home | 10 | 9 | 24.3 | 4.0-10.7 | 36.9 | 0.8-4.0 | 20.8 | 1.8-3.3 | 55.0 | 10.5 |
| Away | 14 | 14 | 23.8 | 4.7-10.9 | 42.9 | 0.7-3.5 | 20.7 | 1.7-3.1 | 53.8 | 11.8 | |
| Neutral | 2 | 2 | 26.0 | 1.5-6.9 | 22.2 | 0.0-3.8 | 0.0 | 3.1-4.6 | 66.7 | 6.2 | |
| Result | Wins | 12 | 11 | 22.7 | 5.0-12.4 | 40.5 | 0.6-4.6 | 12.9 | 1.5-2.6 | 55.6 | 12.1 |
| Losses | 14 | 14 | 25.4 | 3.5-9.1 | 38.3 | 0.8-3.0 | 25.9 | 2.1-3.8 | 55.9 | 9.9 | |
| Month | November | 8 | 8 | 23.9 | 4.4-11.5 | 38.2 | 0.6-5.4 | 11.5 | 1.3-2.5 | 50.0 | 10.7 |
| December | 5 | 5 | 22.8 | 4.6-10.9 | 41.9 | 0.4-1.8 | 20.0 | 2.1-3.5 | 60.0 | 11.6 | |
| January | 6 | 6 | 26.2 | 4.3-11.0 | 39.5 | 0.8-2.5 | 30.0 | 2.3-3.8 | 60.0 | 11.7 | |
| February | 7 | 6 | 23.7 | 3.4-8.7 | 38.9 | 1.0-4.1 | 23.5 | 1.9-3.6 | 53.3 | 9.6 |
Splits Stats - Ball control per game
| gp | gs | mpg | off/g | def/g | reb/g | pf/g | dq/g | ast/g | to/g | a/to | stl/g | blk/g | ||
|---|---|---|---|---|---|---|---|---|---|---|---|---|---|---|
| Event | Total | 26 | 25 | 24.2 | 1.7 | 3.1 | 4.8 | 2.5 | 0.0 | 1.1 | 1.8 | 0.6 | 0.3 | 0.3 |
| Conference | 12 | 11 | 24.2 | 1.8 | 2.9 | 4.7 | 2.8 | 0.0 | 0.8 | 1.8 | 0.5 | 0.3 | 0.4 | |
| Exhibition | 2 | 2 | 24.0 | 3.0 | 4.0 | 7.0 | 3.0 | 0.5 | 1.0 | 2.5 | 0.4 | 0.5 | 1.5 | |
| Location | Home | 10 | 9 | 24.3 | 1.4 | 2.7 | 4.1 | 2.4 | - | 0.8 | 1.8 | 0.4 | 0.4 | 0.5 |
| Away | 14 | 14 | 23.8 | 2.1 | 3.4 | 5.5 | 2.6 | 0.1 | 1.1 | 1.9 | 0.6 | 0.3 | 0.2 | |
| Neutral | 2 | 2 | 26.0 | 0.5 | 3.5 | 4.0 | 2.5 | - | 2.5 | 2.0 | 1.3 | 0.0 | 0.0 | |
| Result | Wins | 12 | 11 | 22.7 | 2.2 | 3.2 | 5.3 | 2.3 | 0.0 | 1.0 | 1.5 | 0.7 | 0.3 | 0.3 |
| Losses | 14 | 14 | 25.4 | 1.4 | 3.1 | 4.4 | 2.7 | 0.1 | 1.1 | 2.1 | 0.5 | 0.3 | 0.3 | |
| Month | November | 8 | 8 | 23.9 | 1.5 | 2.8 | 4.3 | 2.3 | 0.0 | 1.4 | 1.8 | 0.8 | 0.3 | 0.1 |
| December | 5 | 5 | 22.8 | 2.4 | 4.0 | 6.4 | 1.8 | 0.0 | 1.4 | 2.2 | 0.6 | 0.4 | 0.4 | |
| January | 6 | 6 | 26.2 | 2.3 | 3.8 | 6.2 | 3.2 | 0.0 | 1.0 | 2.3 | 0.4 | 0.3 | 0.7 | |
| February | 7 | 6 | 23.7 | 1.0 | 2.3 | 3.3 | 2.9 | 0.1 | 0.6 | 1.3 | 0.4 | 0.3 | 0.1 |
Splits Stats - Ball control totals
| gp | gs | min | off | def | reb | pf | dq | ast | to | a/to | stl | blk | ||
|---|---|---|---|---|---|---|---|---|---|---|---|---|---|---|
| Event | Total | 26 | 25 | 628 | 45 | 81 | 126 | 66 | 1 | 28 | 48 | 0.6 | 8 | 8 |
| Conference | 12 | 11 | 290 | 21 | 35 | 56 | 33 | 0 | 10 | 22 | 0.5 | 4 | 5 | |
| Exhibition | 2 | 2 | 48 | 6 | 8 | 14 | 6 | 1 | 2 | 5 | 0.4 | 1 | 3 | |
| Location | Home | 10 | 9 | 243 | 14 | 27 | 41 | 24 | - | 8 | 18 | 0.4 | 4 | 5 |
| Away | 14 | 14 | 333 | 30 | 47 | 77 | 37 | 1 | 15 | 26 | 0.6 | 4 | 3 | |
| Neutral | 2 | 2 | 52 | 1 | 7 | 8 | 5 | - | 5 | 4 | 1.3 | 0 | 0 | |
| Result | Wins | 12 | 11 | 272 | 26 | 38 | 64 | 28 | 0 | 12 | 18 | 0.7 | 4 | 4 |
| Losses | 14 | 14 | 356 | 19 | 43 | 62 | 38 | 1 | 16 | 30 | 0.5 | 4 | 4 | |
| Month | November | 8 | 8 | 191 | 12 | 22 | 34 | 18 | 0 | 11 | 14 | 0.8 | 2 | 1 |
| December | 5 | 5 | 114 | 12 | 20 | 32 | 9 | 0 | 7 | 11 | 0.6 | 2 | 2 | |
| January | 6 | 6 | 157 | 14 | 23 | 37 | 19 | 0 | 6 | 14 | 0.4 | 2 | 4 | |
| February | 7 | 6 | 166 | 7 | 16 | 23 | 20 | 1 | 4 | 9 | 0.4 | 2 | 1 |
Splits Stats - Ball control per 40 min
| gp | gs | mpg | off/40 | def/40 | reb/40 | pf/40 | dq/40 | ast/40 | to/40 | a/to | stl/40 | blk/40 | ||
|---|---|---|---|---|---|---|---|---|---|---|---|---|---|---|
| Event | Total | 26 | 25 | 24.2 | 2.9 | 5.2 | 8.0 | 4.2 | 0.1 | 1.8 | 3.1 | 0.6 | 0.5 | 0.5 |
| Conference | 12 | 11 | 24.2 | 2.9 | 4.8 | 7.7 | 4.6 | 0.0 | 1.4 | 3.0 | 0.5 | 0.6 | 0.7 | |
| Exhibition | 2 | 2 | 24.0 | 5.0 | 6.7 | 11.7 | 5.0 | 0.8 | 1.7 | 4.2 | 0.4 | 0.8 | 2.5 | |
| Location | Home | 10 | 9 | 24.3 | 2.3 | 4.4 | 6.7 | 4.0 | 0.0 | 1.3 | 3.0 | 0.4 | 0.7 | 0.8 |
| Away | 14 | 14 | 23.8 | 3.6 | 5.6 | 9.2 | 4.4 | 0.1 | 1.8 | 3.1 | 0.6 | 0.5 | 0.4 | |
| Neutral | 2 | 2 | 26.0 | 0.8 | 5.4 | 6.2 | 3.8 | 0.0 | 3.8 | 3.1 | 1.3 | 0.0 | 0.0 | |
| Result | Wins | 12 | 11 | 22.7 | 3.8 | 5.6 | 9.4 | 4.1 | 0.0 | 1.8 | 2.6 | 0.7 | 0.6 | 0.6 |
| Losses | 14 | 14 | 25.4 | 2.1 | 4.8 | 7.0 | 4.3 | 0.1 | 1.8 | 3.4 | 0.5 | 0.4 | 0.4 | |
| Month | November | 8 | 8 | 23.9 | 2.5 | 4.6 | 7.1 | 3.8 | 0.0 | 2.3 | 2.9 | 0.8 | 0.4 | 0.2 |
| December | 5 | 5 | 22.8 | 4.2 | 7.0 | 11.2 | 3.2 | 0.0 | 2.5 | 3.9 | 0.6 | 0.7 | 0.7 | |
| January | 6 | 6 | 26.2 | 3.6 | 5.9 | 9.4 | 4.8 | 0.0 | 1.5 | 3.6 | 0.4 | 0.5 | 1.0 | |
| February | 7 | 6 | 23.7 | 1.7 | 3.9 | 5.5 | 4.8 | 0.2 | 1.0 | 2.2 | 0.4 | 0.5 | 0.2 |
News Mentions
Hawks Take Down LaGrange To End Regular Season
February 17, 2024
Hawks Hot Shooting Takes Down The Blazers
February 14, 2024
Maryville's Second Half Push Too Much For The Hawks
February 3, 2024
Hawks Second Half Push Comes Up Short At LaGrange
January 20, 2024
Hawks Fall In Battle With Berea
January 13, 2024
Scots Hot Shooting Drowns The Hawks
January 12, 2024
Hawks Pull Out Tight Win At Covenant
January 5, 2024
Hawks Can't Get It Going Against Paine
December 30, 2023
Hawks Push Division II Montevallo To Two Overtimes
December 19, 2023
Hawks win tight one on the road
December 8, 2023
Hawks hold on vs Welch
December 4, 2023
Hawks can't overcome 1st half deficit at Rhodes
December 3, 2023
Hot 2nd half fuels runaway from Millsaps
November 29, 2023
Hawks snap streak with win over PCC
November 28, 2023